So we got to work…
We knew we had a problem where CUDA might be part of an answer, especially for performance. And in reality, there’s only one way to find out which horse is faster. You race the horses. We knew that the v1 tag-engine was poorly designed (organically, so to speak), so it wouldn’t be meaningful to compare that for performance purposes. And even if the GPU is better, we still wanted a better CPU implementation:
- it needs to run on developer local machines; not all developers have a CUDA device, especially if they are on a laptop, or on a VM, or on a VM on a laptop
- in the event of the tag-engine servers being unreachable, our fallback strategy is to load the tag-engine in-memory on the production web-servers, so it needs to be able to run there
- if the GPU approach turns out to not be what we want, we still want to have moved our code forwards
- and if the GPU approach turns out to be exactly what we want, then we’d have physical factors like server hardware, cage configuration, etc to add lead-time, where-as we’d like to replace the code ASAP
So: we definitely wanted a shiny new CPU version, but one that was designed to work nicely side-by-side with the GPU version. The other thing you need to race your horses is: a course. The best way of representing your load is to capture your load, in a way that you can play back. So the next thing we did was to edit our existing tag-engine to make it possible to record all the real requests it was serving, in a way that we could play back and use to compare performance, features, and results. Helpfully, tag-engine requests don’t contain any PII data – note that this isn’t possible in all circumstances.
Parallel or sequential?
Next up, we need to think about how GPUs work. CPUs are often (not always) used to perform multiple independent operations in parallel. GPUs, by contrast, are usually used to make a single operation (per device) happen really quickly, processing the operations sequentially. The parallel approach, while scalable, has a lot of complications:
- you need to be careful how you perform data updates without breaking running operations (or: you need to duplicate the data to perform updates) – contrast sequential, where you can just squeeze the update in as just one more thing in the queue (it is never fighting other requests), and update the data in-place with impunity
- each parallel operation needs memory for it’s processing (the results it has collected, and everything it needed to get there) – contrast sequential where you can allocate a single workspace and just keep re-using it
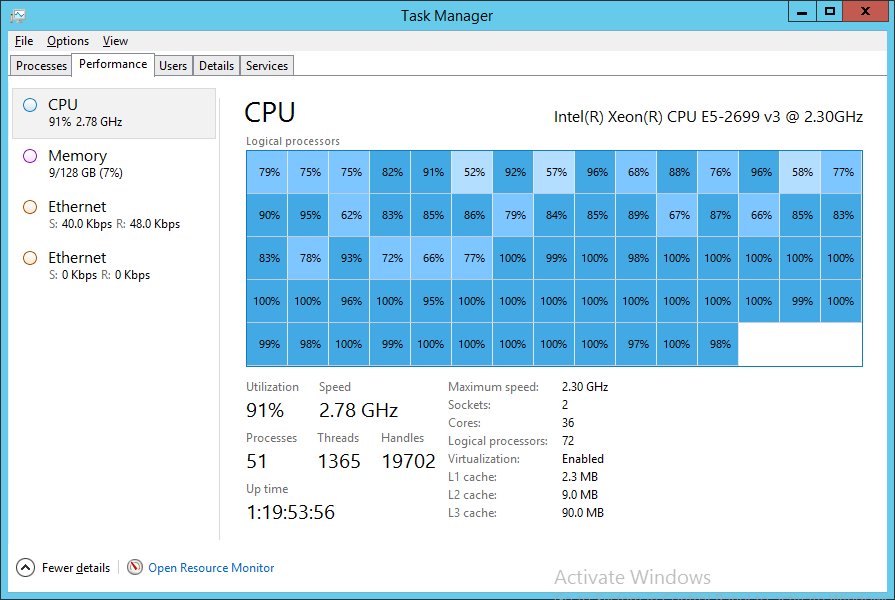
After considering these factors, and looking at our typical request rate, we concluded that our best approach for both GPU and CPU would be to use sequential operations, using all the resources available to us (cores, etc) to make each individual operation as fast as possible. This also makes for a very simple CPU vs GPU race, while also making for some amusing CPU task-manager charts:

(yes, that’s me punishing a 36-core, HT-enabled server for 72 logical cores of goodness)
The CPU bits
Recall from part 1 that we have two categories of query; trivially simple, and absurdly hard. I’m going to completely ignore the first set. The interesting case is the second, and in those scenarios you can pretty much guarantee that there is no single index that is ever going to fit your query, and we’re essentially trying to do a table-scan of a “where” clause, perhaps with some short-cuts. Let’s consider an example. Say we want to know all the “java and android” questions, sorted by activity. One of the main things the tag-engine stores is an index of “questions by tag” – i.e. given a tag, what questions exist in that tag (pre-sorted). Since the “and” makes this restrictive (intersection rather than union), what we can do is choose the smallest (“android”, which takes us to a manageable size) and then just test them all. For reasonable sizes of data, this can be much cheaper than trying to do complicated index combinations, and can be done with very little memory allocation. Note that we almost always want the total count and the “intersecting related tags” data, so it won’t help to cheat and just scroll forwards until we have enough data to return.
Let’s say that “android” has 800,000 questions. If we want to parallelize this work (to use all of the available cores), it might be tempting to use Parallel.ForEach to outsource this work to the TPL and aggregate the results, but:
- this has quite a lot of overhead in terms of doing lots of small things instead of a small number of big things
- since the order is now unpredictable, it makes it very hard to exploit the fact that we have pre-sorted the data
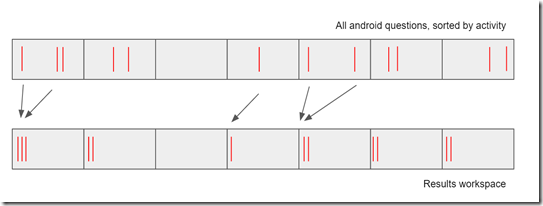
Instead, what we can do is to carve these 800,000 questions into a small number of chunks of contiguous questions (8, say, or something related to the number of available cores), and then inside each chunk (unit of work): test each question in turn for the remaining conditions, writing successive matches in blocks to a similarly sized workspace.
By letting different threads process different blocks, we get lots of benefits:
- the number of units-of-work for the threading library (TPL) to manage is minimal, reducing overheads
- each unit-of-work is always looking at contiguous data, maximizing cache usage and memory locality
- we get to exploit the fact that we’ve already sorted the data once – we never need to re-sort
- we don’t have to synchronize when writing any of the results, since each unit-of-work is writing to a separate area of the workspace
- all we need to know is how many matches each unit-of-work contained and we can step through the final workspace very efficiently
This is actually pretty simple to do with Parallel.Invoke - something like:
int chunks = DecideNumberOfChunks(questions, cpuCores);
int workPerChunk = questions / chunks;
WorkUnit[] workUnits = new WorkUnit[chunks];
Action[] actions = new Action[chunks];
for(int chunk = 0; chunk < chunks ; chunk++) {
    int start = chunk * workPerChunk,
        stop = Math.Min(start + workPerChunk, questions);
    workUnits[chunk] = new WorkUnit(start, stop, ...);
    actions[chunk] = workUnits[chunk].Execute;
}
Parallel.Invoke(actions);
Where each Execute method is essentially:
public void Execute() {
    int matches = 0, resultIndex = start;
    for(int i = start ; i < stop ; i++) {
        if(IsMatch(i)) { // some test or set of composite tests
            resultWorkspace[resultIndex++] = i;
            matches++;
        }
    }
    this.Matches = matches;
}
The above is a very simplified illustration of the design that drives the CPU implementation of the re-written tag-engine. The result is that it creates a packed set of contiguous matches for each unit-of-work, while allowing us to scale the query effectively over all the available CPU cores. The IsMatch method might be non-trivial, of course. We use a combination of meta-programming and special-cased tag-tests to allow us to support a wide range of queries; it works very well. So how does this compare to GPU? How does it change our approach?
CUDA: Kernels, Threads, Warps, Blocks and Grids
I’m going to run through some high level CUDA concepts now before showing any CUDA code, and before showing how it relates to the tag-engine.
When developing with CUDA, the first things you need to learn about are kernels, blocks and grids. A kernel is just a chunk of your code that you can invoke on the GPU device. But unlike regular code, when you “launch” a kernel, you aren’t usually asking it to call it once; you’re asking it to call the exact same method lots of times. As a trivial example, we could ask it to call the same kernel 800,000 times – once for each of our 800,000 “android” questions. A kernel designed to be called once per input element is sometimes called a “monolithic” kernel. But that isn’t quite the end of the story. Each separate invoke of the kernel is a “thread” – so in this monolithic case, we’d be launching 800,000 threads – but we don’t just ask for 800,000 – instead we might ask it to launch 3125 “blocks”, with each block consisting of 256 “threads”. Each of these numbers has limits – a block is limited to a maximum of 1024 threads on most current hardware, and you can have a maximum of 65535 blocks (per dimension, but that’s a separate story).
This means that for a single-dimension kernel, there’s a limit of about 67M, but don’t worry – I’ll cover how to get around that later. All I’m trying to do here is give an overview of the topology of what we’re playing in. The significance of these different concepts is that per-clock-cycle, each symmetric multiprocessor in a GPU actually works on multiple threads in the same block. This ability to operate on multiple threads at once is what makes GPUs so much more powerful (for some tasks) than CPUs. This group of threads that are being controlled in unison is a “warp” (the warp-size is 32 in current hardware).
The above is then duplicated for however many blocks you asked for – 3125 blocks of 256 threads in our example, with a warp-size of 32. In simple examples we’re often just talking about 1 dimension, but note that CUDA blocks and threads are actually 3-dimensional; this means you can actually have 65535 x 65535 x 65535 blocks, with 1024 threads per block – but… you probably shouldn’t ever do that! That’s not the way to solve the “more than 67M” problem.
Why do I need to know?
There are a few reasons why you need to understand the topology; firstly, in addition to knowing the limits of what you can ask for, it impacts things like memory locality and cache. Remember in the CPU example we optimized by having each thread work on a different chunk of data? In CUDA, a warp of threads will be executing at once (per symmetric multiprocessor), and the infrastructure is built specifically to share memory lookup costs between a warp. Because of this, you usually want all the threads in a warp looking at adjacent data.
The “secondly” is perhaps even more important: the ability of a symmetric multiprocessor to progress multiple threads simultaneously is dependent upon each of those threads doing exactly the same thing. Which makes sense when you think about it. This doesn’t mean that your CUDA code can’t ever branch (if, etc - basically, any decision point), but it does mean that if different threads in a warp branch in different directions, then the symmetric multiprocessor has to identify the ones in different states and progress them separately. Which means: you kill the performance.
So: aim to work on adjacent data, and try to branch in a single direction.
How does this impact tag-engine matching?
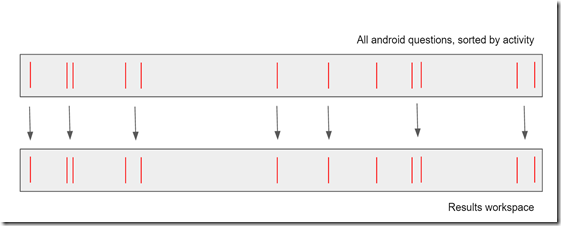
If we go back to the index that we described in the CPU example, we are now essentially applying all our tests in parallel (at least, in a single kernel launch; how the hardware schedules it is up to the hardware). With this setup, we can’t really have the concept of “write to the next position in the result index and increment the write-position”, because all matches in a single CPU cycle would want to write to the same position. CUDA of course provides mechanisms for doing atomic increments, but if these collide you’re ultimately going to be branching and breaking the lock-step on the warps – and more importantly, since we don’t control which thread runs when, we’d actually be randomizing the results, which would require us to sort the data again.
So; instead of trying to write packed data, we’ll instead try to create a sparse vector of just the matches – so zero (or another sentinel) for data that didn’t match, and the key otherwise:
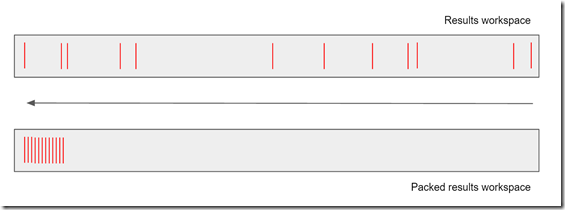
What we’ll then do is pack that down to give just the non-zero data:
Note that we’ve preserved the sort on the data, and now we’re in a position where we can just do a memory copy from the device (GPU) to the host (CPU) of just the page of results we want.
Show me some code!
OK, time for some CUDA. Note that there are are many ways of creating CUDA binaries, and I intend showing much more on this next time – but for now, I’m using C code, since that works directly with NVIDIA’s tooling.
The first thing we need to do is to figure out what element we’re meant to be processing. CUDA makes available to us the block dimensions (blockDim), the logical position of the current block (blockIdx), and the logical position of the current thread inside the block (threadIdx). For a 1-dimensional kernel, this means that our actual index is:
int i = blockIdx.x * blockDim.x + threadIdx.x;
We can also assume that the kernel has access to the underlying data (I’ll demonstrate this next time), and somewhere to put the results. For simplicity, let's consider a test on the score of the post; what we want to do is essentially:
Question* q = allData + i; // pointer arithmetic
results[i] = (q->score >= minScore && q->score <= maxScore) ? i : 0;
However, the observant might notice that both the short-circuiting "and" (&&) and the ternary-conditional (? :) are branching operations, and are best avoided. Fortunately, it isn't hard to rewrite this using non-branching equivalents. The "and" is simple - we'll just make it non-short-curcuiting. The conditional is harder, but "true" in C is expressed by the number 1. This means that if we negate (numerically, not bitwise) the result of our boolean test we get 0 and -1; and -1 in two's-complement binary is "all the ones". This means we can just do a bitwise "and" between this and the number we want to store (i):
results[i] = (-(q->score >= minScore & q->score <= maxScore)) & i;
While it might not be as intuitive, this type of thinking is key to keeping warps in lock-step to get the maximum performance from the GPU.
OK, I see why this might be useful, but how well does it work in practice? Is it worth it?
Note: as I have tried to emphasize: all performance data is deeply dependent on your exact scenario and your exact implementation. I’m going to talk about what we’ve found, but please don’t use this to justify a big hardware spend: race your own horses.
All of this work would be purely academic if it didn’t help us. So we’ve spent a lot of time and effort comparing performance using our captured data between the CPU versions (v1 and v2) and the GPU version, using a range of devices. For local development purposes today, a GTX 980 is more than sufficient.
So without further ado: some numbers. Looking only at the “hard” queries (the easy queries aren’t a bottleneck), the 72-core high-end server that I showed in the task-manager screenshot above managed and average of 259.9 requests per second for the CPU version – 3.8ms per request, which is pretty respectable for non-trivial filters against 12 million records. The GPU version, however, managed nearly double that (507.7 requests per second) just on my development GTX 980. This is not “high end” in GPU terms. There are server devices like the K40, K80 (two K40s back-to-back with a shared power limit), and the M40 which are quite a bit more powerful, and in my testing the maximum throughput went up linearly as you added more GPUs. Given that a C4130 has space for 4 GPUs, that could give you 4 M40 devices or 8 K80 devices (two devices per package), to get a massive speedup compared to CPU limits.
And also note: the GTX 1080 (desktop) and P100 (server) around the corner boasting the next generation of architecture and hopefully another huge jump in performance (I haven’t got my grubby hands on those yet).
But: from what we’ve seen, we’re keen to push to the next level and get some of this kit deployed into production.
My curiosity on CUDA is piqued; are you done? what next?
No, you don’t shut me up that easily! Next time, I’m going to be talking about things like grid-stride loops, async and CUDA streams, memory transfers, and showing how we can get access to all this goodness from my preferred every-day language: C#. I’ll also be walking you through some code that you can clone and play with to see it in action, rather than as text.


